This is the story of my most fondly remembered project from my time on the S3 storage team in AWS.
When I joined S3 in 2018, my team owned a service that was just a high-throughput, in-memory cache. When telling people about it they would ask, "Why not redis or memcached?" The answer was that this service (let's call it S3Cache) was as old as S3, i.e., about as old as memcached and older than redis, so those weren't really options at the time. But it served a similar purpose and served it well enough that there had never been any reason to switch. It was a critical service — a cache lookup was needed for every GET or PUT to S3. But it was simple and stable. It had hardly changed in over a decade. Until I joined, operating it mostly consisted of occasionally scaling the service in growing regions.
S3 was the very first AWS service to launch. So of course it did not, initially, run on AWS itself. In the fullness of time, it would, but in 2018 S3 was still mostly operating on custom bare metal hardware in Amazon's legacy prod network. Since S3Cache was simple, stable, and stateless, it was a good candidate to be one of the first services to make the switch to EC2. The idea was that it would run on EC2 and still communicate with the rest of the S3 services running on legacy hardware via a link between the two networks. Everyone thought this would be an easy transition. But how could we know that it would work? My first assignment in S3 was to answer this question.
Understanding S3Cache
First, I had to understand how the service worked. Here are the key points.
It spoke a custom network protocol that could be layered over either TCP or UDP, like all S3 services.
It was written in java and ran on the JVM, like all S3 services at the time.
It listened on multiple ports: one port for TCP requests, which were mainly admin actions and updates, and a configurable n ports for UDP requests, which were exclusively reads of the data in the cache.
The most important scaling dimension was read throughput. This service had to handle S3-scale transactions per second. At least one for every GET, PUT, and DELETE. We managed that on a relatively small number of instances.
Latency was also important. Typical client-measured latency for a single read was around 1 ms at the 99th percentile.
Since we used UDP, we didn't expect 100% availability. It was difficult to define a good availability metric for alarms for this service, for reasons that we'll cover in the next section, but we generally were fine with client-reported failure rates of 0.5% or lower. With low enough latency and high enough throughput, retrying some small proportion of failures was OK.
The UDP listeners were designed to avoid allocations and reuse buffers, so garbage collection on this service would be infrequent and fast. This was important to preserve our latency, throughput, and availability goals, as we will see below.
My first project
In order to qualify S3Cache for operation on EC2, we needed to be able to start it up on an EC2 instance, throw some load at it, observe that latency and error rates were within acceptable bounds, and measure throughput. We expected to use a larger number of smaller instances in EC2, but we needed to know how many instances of what size we would need.
We happened to have a load generator lying around that could theoretically serve this purpose. Now, nobody had used this thing in a while, so I had some work to do to make it useful. First, I added a seed step to warm the cache with fake-but-realisitic-looking data. Then, I had to change it to be reliable enough to actually measure S3Cache's performance, rather than its own performance.
The library we all used to communicate over UDP worked by just keeping requests around for some short time, and matching them by request ID against the incoming response datagram. Since UDP provides no delivery guarantees or any capability to detect and retransmit lost packets, basically all failures looked like request timeouts. But we can distinguish two different failure modes that look identical from the client's perspective:
- S3Cache failed to send a response.
- S3Cache sent a response, but it was not received or processed before the timeout.
Type 1 failures did happen. In fact, this type of failure mostly accounts for the up-to-0.5% of reads that are expected, acceptable failures, as we'll discuss below. But invariably when a client of the service observed higher failure rates, it was because they were under pressure, and consequently failing to process requests in time. This often manifested as an increased number of dropped UDP packets, as socket buffers filled up.
You can observe this (on Amazon Linux 2) at /proc/net/snmp, which has an
InErrors counter for UDP. This counter is incremented when a packet is dropped or has a bad
checksum. If you're dropping packets because your buffer is full, you'll see this counter go up. And
that is exactly what we saw on the load generator when we first attempted to ramp it up to
production-like load. The load generator fell over well before S3Cache did.
I won't get into the details of how I resolved that problem — basically by shifting to parallel load generation, but also some optimization in the load generator code itself. I mention it because we're going to need to distinguish this failure mode, which we were familiar with, from a new failure mode that we weren't.
Normal operation
So we'd run S3Cache on some box and point the load generator at it, and gradually ramp up our read
transactions per second (TPS).
A normal, qualifying result would look like this: 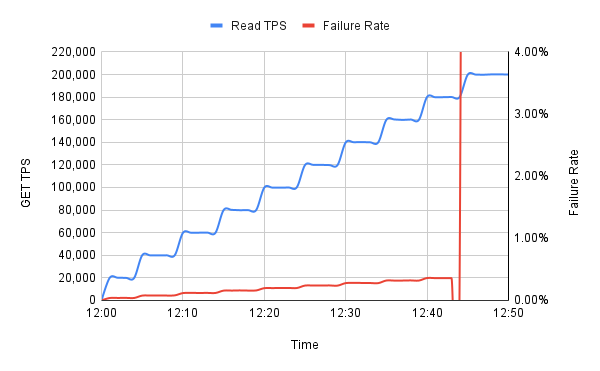 This is an entirely fake graph with made up numbers, but it shows the shape of things. If this were a real result, it would indicate that we can operate S3Cache on this type of box up to 180,000 TPS. So we'd want however much capacity would spread the load out to around 120,000 TPS per instance, leaving enough extra capacity to absorb a loss of ⅓ with no loss of availability.
We observed that failures increased gradually with read throughput, even before reaching the point where the service falls over. What accounted for those failures? It turned out that if you compared UDP InErrors on the S3Cache host to the failure rate, the curves matched almost perfectly. And I further discovered that the InErrors weren't distributed evenly over time, but instead occurred in bursts — bursts that corresponded to pauses for garbage collection in the JVM. What was happening was that some UDP packets were being lost when queues formed during GC pauses that overflowed the socket buffers. But as long as the request rate was low enough, S3Cache could catch up and drain what made it into the buffer after the pause ended.
So in normal operation, basically all observed read failures were the result of UDP datagrams being dropped by S3Cache's host OS or the client's host OS due to overflowing socket buffers.
EC2 qualifying run
Here's what happened when we attempted to qualify S3Cache on an EC2 instance.
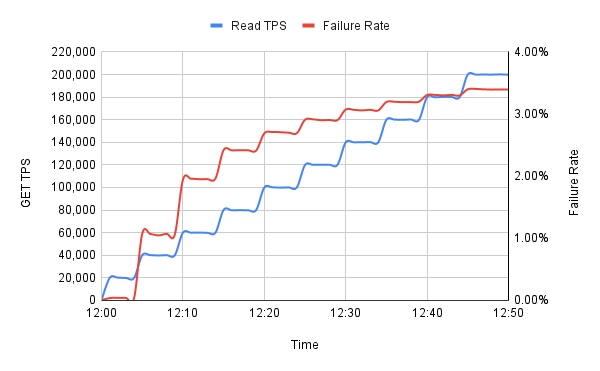 The failure rate in this graph jumped up to an unacceptably high error rate very early in the run, and then gradually
increased after that. After the jump, the curve was logarithmic in shape, with what
appeared to be a limit around at around 3.5%.
The failure rate in this graph jumped up to an unacceptably high error rate very early in the run, and then gradually
increased after that. After the jump, the curve was logarithmic in shape, with what
appeared to be a limit around at around 3.5%.
The real mystery was that we did not observe elevated UDP InErrors at either end. This was a new, previously unseen failure mode.
We also observed that the request counts recorded by S3Cache more-or-less matched what was being sent (modulo the usual amount of InError loss), and to all appearances these requests were being successfully processed and a response sent. But the load generator never saw the responses. Something was happening in between.
The first clue
It happened that a colleague on another team was looking at a similar issue, and had already identified that the datagram loss correlated with size — their hypothesis was that we were specifically losing datagrams larger than approximately 1500 B. Most of the datagrams were smaller than 1500 B, and the ones that were larger weren't much larger. We quickly validated this hypothesis by modifying the load generator to seed only data smaller than that, and seeing that this produced a more normal load test pattern on EC2.
So, great, problem solved! We could just compress to reduce datagram size, and all would be well.
This possible solution had a few drawbacks. One, we didn't know what compression would do to our throughput. Probably it would have been fine for S3Cache, and in fact might have been good for vertical scalability as well, because we could just cache the compressed bytes, in theory. But many other services would have had extra work to do to compress and decompress, and at the request rates we were talking about, we couldn't assume that was a negligible amount of work. It would have required a lot more testing, and likely increased our hardware spend.
Two, we'd have had to modify S3Cache and all other services that passed around this sort of data — of which there are several. And remember that we were on the critical GET and PUT request path. That's a complicated, multi-team effort.
Implementing this solution would have taken months to complete. That was longer than we wanted it to take. Another reason we wanted to get S3Cache on EC2 is that we needed to vertically scale in some regions, but we didn't necessarily have hardware available in those regions we could scale to. EC2 solved that problem. It wasn't a hard deadline — there were other potential solutions — but the delay would have meant even more work to solve this secondary issue.
Moreover, while this certainly would have worked around the issue, I wasn't happy. We still didn't really understand the root cause. Why were we losing datagrams over 1500 B? And why did the rate of loss correlate with throughput? We had shown that we were losing only large datagrams, but not that we were losing all large datagrams.
What wasn't the explanation?
The ready-to-hand hypothesis for why 1500 B was a relevant threshold was that this was the maximum transmission unit (MTU) of the network interface on the hosts we were using in the legacy prod network. That meant that any datagram larger than that size would need to be fragmented and sent across two IP packets. So we immediately considered the hypothesis that we were losing fragmented packets as an explanation for why we were losing larger datagrams. But the hypothesis that we were losing all fragmented packets didn't fit the evidence.
The load generator seeded all the data in the cache for the qualifying run, so we knew its properties, and could infer that about 3.5% of datagrams would have been larger than 1500 B. The load generator's access pattern was random, so this should have resulted in a constant 3.5% failure rate if all fragmented datagrams were lost.
Moreover, the 1500 B MTU was a relevant factor without EC2 in the picture. Fragmentation is not great in UDP generally, since it increases the probability that a datagram is lost — if any single fragment is lost, the entire datagram is. But nevertheless we'd been living with a non-trivial fragmentation rate for years. It's worth noting here that, when S3Cache was originally designed, all of its responses would have fit in 1500 B, so this was an unplanned change in the system's behavior that had gone unnoticed because it had never caused a problem before.
Another hypothesis we considered was that the EC2 instance was not fragmenting larger datagrams, because it had a 9001 B MTU on its network interface. So maybe these datagrams were being lost because they were too big to fit down the pipe. But that, too, failed to fit the evidence, as it would have resulted in a loss of all too-big datagrams.
This raised a question: how was the EC2 host supposed to know that the recipient's MTU was 1500 B, so that it could fragment accordingly? At the start of this journey I didn't even know what "MTU" stood for, so I'd certainly never heard of path MTU discovery (PMTUD), which is the answer to that question. It seemed likely that the MTU size was relevant, but I couldn't explain how it interacted with the system to produce the failure rate curve we observed. It was time to learn more.
How does PMTUD work?
Path MTU discovery is a process that uses the Internet Control Message Protocol (ICMP) to determine the minimum MTU of every hop along the path to a particular destination. The header of an IP packet contains flags used to control and identify fragments. One of these bit flags means "Don't fragment", and when this flag is set, a gateway is required to drop the packet if it is larger than the MTU of the next hop in the packet's journey. It may also return a type 3 "destination unreachable" ICMP message with code 4 to indicate that the packet was dropped and why.
Now that's not enough information: if you want to try again, you need to know not only that the packet was too big, but how small the fragments need to be for transmission to succeed. So RFC 1191, which specifies PMTUD, elevates the ICMP response to a requirement and requires the inclusion of the next-hop MTU in a portion of the ICMP response that was unused.
With that information, the sender can discover the minimum MTU for a path by always setting the don't fragment bit, and, any time it gets an ICMP "fragmentation needed" message, it caches the next-hop MTU by destination. Then the next time it sends a datagram to a destination in the cache, it pre-fragments, ensuring that each fragment fits into the smallest known MTU for that path. After sending at least as many packets as there are hops on the path, it's guaranteed to learn the true path MTU and won't lose any more datagrams, at least not for the "fragmentation needed" reason.
This algorithm is implemented in the Linux kernel, and I confirmed that path MTU discovery was enabled by default on the EC2 instances we were testing. So, since they could send jumbo dataframes of up to 9001 B, S3Cache should have been sending larger datagrams whole, with the don't fragment flag set, and then receiving back ICMP "fragmentation needed" messages with a next-hop MTU of 1500 B, after which it would cache this by destination and pre-fragment large datagrams to the same destination.
Since UDP has no mechanism for re-transmitting, and our application layer didn't either, datagrams lost while probing for the path MTU would have been lost for good. That should have accounted for a small number of errors, but it couldn't explain the majority. The load was generated from only a handful of hosts, so we should have lost only a handful of datagrams before learning the path MTU for all of them, after which fragmentation should have kept our packets small enough to fit down the pipe.
At this point, I considered the possibility that we weren't successfully caching the path MTU, or were invalidating the cache. But I couldn't imagine why that would be happening, and found it hard to get clear on the details of the caching strategy Amazon Linux would have been using. So I didn't pursue this line of inquiry, thinking it was probably a red herring (it was).
Instead, having confirmed that large datagrams would have been fragmented, I suspected that some, but not all, fragmented datagrams were being dropped by a node on the path in between S3Cache and the load generator. So we needed to understand what lay in between.
The Elastic Network Adapter takes the stage
The first stop for a network packet after leaving the kernel networking layer is the network interface. That's not what you'd normally consider a "hop" on the path to the destination, but it is a distinct component that handles the packet.
In 2016, Amazon announced the Elastic Network Adapter (ENA), a new virtual network interface for next-generation EC2 instances. The instances we were load testing were 5th-generation general purpose or memory optimized instances, which was the first generation of these instance types to use ENA.
I was fortunate enough, working at AWS, to be able to speak directly to the EC2 networking team. And when I reached out to them, they immediately told me:
- Don't send fragmented packets. They're bad; we don't offer performance guarantees in that case. Unexpected behavior can result.
- If you do send fragmented packets, the current version of ENA doesn't fast-track those, but offloads to a less efficient processor.
- In order to avoid load on the CPU, ENA rate limits fragmented packets to around 1000 per second.
It was at precisely this point that I had enough information to determine what was happening. Using
path MTU discovery, S3Cache's host OS was determining that the path MTU was 1500 B, and fragmenting
datagrams that didn't fit. It was sending those fragments to ENA, which sent them through a
separate, non-optimized path to the network. Since we expected 3.5% of our datagrams to be
fragmented, and the rate limit was around 1000 per second, that means we could reach a total
transaction rate of around 28,500 datagrams per second before hitting the rate limit, which explains
why the initial portion of the load test would see the normal, low error rate. Then, after exceeding
that transaction rate, we would expect a loss rate of tps * 0.035 - 1000 datagrams per second (plus
our normal failures), where
tps is the throughput our load generator was pushing. And this would cause our failure rate to asymptotically approach
3.5% or so.
I should note, by the way, that I believe the networking team was working on removing this limitation, and I don't know whether it still exists. But it did in 2018.
Now that we understood what was happening, a possible workaround presented itself. If we wanted to fragment our
datagrams but also bypass the rate limit in ENA, we could just never fragment at S3Cache, even when
sending datagrams larger than the path MTU. For this to work, we'd need to unset the "don't
fragment" flag, allowing downstream nodes to fragment as needed — otherwise we'd guarantee
that all large datagrams would be lost. But since at the EC2 host we get to
use jumbo frames, fragmentation wouldn't be necessary until some point downstream of ENA. All of this
could be accomplished with a single kernel setting: ip_no_pmtu_disc = 1 means stop doing path MTU
discovery, and unset "don't fragment".
Et voilà! Astute readers will notice that this solution ignores the networking team's point #1, which they insisted on quite emphatically. Avoiding fragmentation for TCP segments is, after all, the whole point of PMTUD. For UDP, however, avoiding fragmentation requires application-level support, since the protocol has no mechanism for sending a datagram in multiple segments. Or, ideally when using UDP, you just guarantee that your maximum datagram size is less than your minimum path MTU for all destinations.
We didn't have any application-level support for this. We were relying on IP fragmentation, and had been relying on it (unnoticed) for years. It just hadn't been an issue until we hit the ENA rate limit.
So if fragmentation had been working fine for us for so long, it's worth asking why the advice to avoid it (like the plague)? A typical answer is that the internet is composed of a bunch of links with varying behavior. They have different MTU sizes, some of them might not handle fragmented packets at all or might handle them incorrectly (as in this Google Compute Engine issue), some of them might rate limit fragments (ENA!). Fragmentation also increases resource utilization on the nodes that need to do the fragmentation, and therefore might reduce throughput or increase latency, or cause drops like those that we saw at S3Cache during garbage collection pauses. Also, as we noted above, losing any fragment of a UDP datagram means the whole datagram is lost, increasing the probability of datagram loss.
Those are good reasons! And yet, the network path we were traversing was more predictable than the internet. We knew the path MTU would never be less than 1500 B. And we knew that only a small percentage of our datagrams would exceed that size. "We" didn't control the network, in the sense of "we" that only included my team at S3, but "we" did control every point on the path in the sense of "we" that included Amazon as a whole. So even increased resource utilization on the network links due to fragmenting 3.5% of S3Cache datagrams was something that we could just choose to accept and deal with (and in practice we didn't think it would really be a problem).
Moreover, if we set ip_no_pmtu_disc = 1, we'd only be asking downstream nodes to do fragmentation on
a temporary basis. Eventually, all of S3Cache's clients would also be on EC2, and also using jumbo
frames, after which, for the foreseeable future, datagram size would never exceed the path MTU.
We'd be back to the state the system was originally designed for, where we could safely assume that our UDP
datagrams were unfragmented.
We made this one-liner change and saw that as expected it resulted in normal load test results on EC2. We could deploy that to S3Cache only and unblock migration to EC2 without a months-long coordinated cross-team effort.
Coda: another PMTUD + UDP failure mode
So we were running with some portion of the S3Cache fleet on EC2 for a while, as a test, and all was well. We went to stand up more EC2 capacity. There was an availability zone in which the 5th-generation instances weren't available (I think they were to customers, but they wouldn't let us use them there at the time, probably to make sure there was enough supply for customer demand). So we did another qualifying run with our load generator on 4th-generation instance types, which lacked ENA.
Now, we had specialized our configuration change so that it only applied when we detected the presence of the ENA network interface, so on these 4th-gen instances we were still doing PMTUD. But without ENA, we didn't have the fragmentation rate limit, so the qualifying run looked normal and we went ahead and deployed on the 4th-gen instances.
And we immediately got a high-severity alarm from one of S3Cache's clients.
This particular client was not on the GET and PUT path, and was a very low-volume client compared to our clients that were. It was also a low-volume client compared to our load generator. So we hadn't really simulated this client's usage pattern in our qualifying run. Whoops!
We rolled back the deployment until we could figure out what was going on. Fortunately, at this point we had built up a pretty good mental model of UDP failure modes and how they interact with path MTU discovery. So we saw the problem right away. Recall that all large datagrams sent prior to learning that path MTU would be lost forever, and the client would be forced to retry. For high volume clients, these failures were so few that they just went unnoticed in the aggregate failure rate, and would be retried successfully. But this was a low-volume client, meaning that these lost datagrams were a much higher proportion of the total. They were quite noticeable in the aggregate statistics.
In the legacy network that hadn't been an issue, because S3Cache's own MTU was 1500 B, which was the same as the path MTU. So it would always fragment to the size of the path MTU, and no discovery was ever needed. But the 4th-gen EC2 instances also used jumbo frames, so the MTU was bigger than the path MTU, even without ENA.
Fortunately, the fix was similar — we just needed to fragment without doing discovery. This could be accomplished by disabling PMTUD on all EC2 instance types, not just those with ENA.
Conclusion
So why is this my most fondly remembered project? It didn't deliver any direct value for customers. It was the kind of boring operational work that many software engineers hate. All I was doing was deploying a simple service on new hardware.
But it turned out to be both hard and interesting. Hard, because there was a lot I didn't know about the system and what assumptions it implicitly made about the network stack when I started. Interesting, because I got to learn all that in the process. And it resulted in a solution that was simultaneously:
- jury-rigged hackery — a temporary workaround that ignored "best practices";
- elegant — it directly and straightforwardly addressed the root cause with minimal code changes;
- cost-effective — it avoided months of cross-team effort to permanently solve a temporary problem.
In other words, it's a good example of balancing real-world constraints and finding the right set of trade-offs. The way we resolved the issue is not the only way it could have been done. One might even argue that the solution could be improved upon in various ways. But I think we got it roughly right.
« archive